Increase Your Conversion Rate in Salesforce with Astapor Marketing Attribution
What is conversion?
If you’re looking for ways to increase your conversion rate in Salesforce, then read on…
In the Internet world, conversion means getting your potential customer (also known as a lead) to perform a certain action that results in a concrete gain for your business.
For an online store, this is typically when they buy something from you. For other types of online businesses, it can be when they become a registered member, when they start contributing to the community, when they write a review, and so on. It’s up to you as a business owner to define conversion, but it should be that key point in the customer lifecycle when the website user is no longer a visitor (let’s say a “lurker” in Reddit terms…) and they become actively involved with your business.
Why should we care?
Figuring it out which visitor, or prospect, or lead might convert in the near future is important. It helps you set up targeted marketing campaigns that might drive them over the edge. These users often need a little nudge to start contributing to your business, but you need to know which users, and what this nudge should be.
Predicting conversion in Astapor Marketing Attribution
In Astapor Marketing Attribution, we offer a conversion rate prediction feature based on Markov chains analysis. As I mentioned in my post about attribution models, prediction comes as a fortunate side effect of the probabilistic model. We perform the same steps with the same historical data, and as a bonus, we can compute the conversion probability for an opportunity based on the historical interactions with the customer.
In Salesforce, a conversion usually means marking an opportunity as Closed Won. That’s why the conversion probability is an attribute of the opportunity rather than the account.
To get to the conversion probability, we sift through all your closed opportunities, either lost or won.
We then map the customer journey for each opportunity, separating the won from the lost. The result is two graphs: one for converted and one for not converted journeys. Here’s an example of a positive outcome graph, containing all the closed won opportunities your company had.

We then compute the transition probability for each combination of nodes. After drawing all the journeys for the same graph, we calculate the transition probability from A to B as the total number of A-B sides / the total number of sides starting in A. This is how the transition probability matrix will look for the pictured graph:

The final step is to divide the won transition probability by the lost transition probability for each step of the customer journey, and then combine the ratios. This will give us the current conversion probability for a customer journey that is still in progress.
Knowing the conversion probability allows you to focus on the opportunities that are on the edge of conversion. But how to win them over?
Recommendation Engine
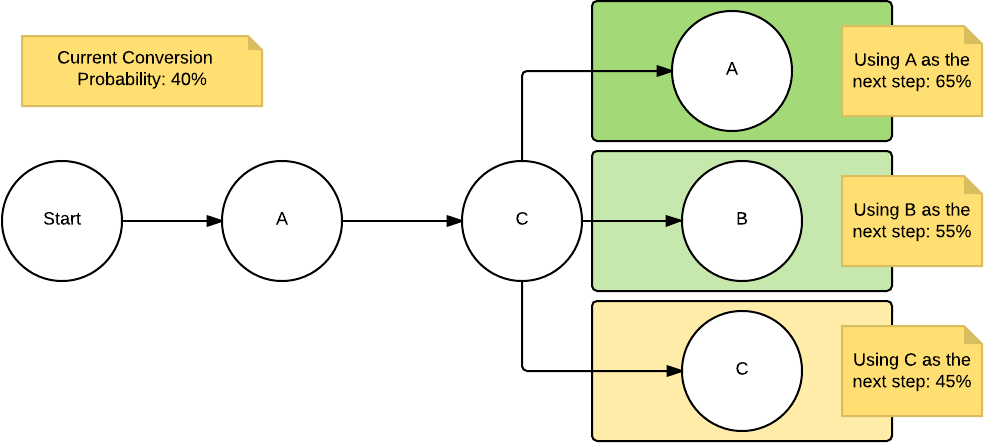
The real value of our model is the ability to offer you suggestions. Based on the current conversion probability, we choose the next step as the one that will push it over 50% (or at least increase the likelihood of conversion). The principle is the same: combine the current probability with the one for each next potential step, and choose the option with the highest impact.

In the picture above, imagine you got to a 40% conversion probability with your efforts so far. Going through all the potential next steps, we realize the best place to go next is A, as this will push the conversion likelihood to 65%. From A, we can repeat the selection process, until we get over a desired certainty threshold (50% by default).
The Astapor recommendation engine looks up to 3 steps ahead, helping you draw a strategy for the opportunities being worked on.
Keep in mind this calculation is a snapshot of the current journey status. If a new interaction is added based on our recommendation, you should register the outcome and then rerun the model. It is quite possible the recommendations will change based on the latest sales data.
