Which Attribution Model is Best for You?
What is marketing attribution?
Before we find the best attribution model for your business, let’s first get a bit more familiar with the term marketing attribution.
Marketing attribution is about identifying a set of user interactions (also known as touchpoints) that contribute in some manner to a desired outcome (typically a conversion), and assigning a value to each of these interactions.
In simpler terms, imagine you are selling a product – digital or otherwise. To get to the step where they buy your product, your potential customers go through a journey made up from small interactions with your company. It may be that they saw an ad on TV, they signed up for a newsletter on your website, and then they read the newsletter. It may also be they were targeted with an ad on Facebook, they clicked on it and then ended up on your website.
The steps vary and depend on the channels you use I your marketing. However, at the end, you can have one of two possible outcomes: the prospect buys your product or they don’t.
Let’s say you are building a list of all these steps that lead to the customer buying a product from you: imagine them as Step 1, Step 2, etc. Then we take the revenue that we got from the purchase (let’s say $100 worth of organic baking powder) and we spread it across these steps.
Why is that useful for you as a company? Because next time you are looking to spend your marketing dollars on TV ads, Facebook ads or paying an employee writing up newsletters, you want to know which of these channels had the most impact on your bottom line. The higher the impact, the more likely you’ll be to invest in it.
Now, the age-old question is how do you spread the money across these customer journey steps?
First thing to do is figure out what is your typical customer journey and simplify the channel list – you might want to exclude outliers like a one-off poster campaign. Let’s say you end up with a set of 3 or so channels you normally use. The sequence of the steps, however, can vary – maybe one customer saw the Facebook ad before the TV ad and so on.
In marketing practice and theory, this process of spreading the customer money across their journey is called attribution. Sometimes campaign attribution – since these steps or channels can very often be online or offline campaigns. Or at least that’s how marketing managers see them.
Heuristic attribution models
There are two main types of methods (or models) used to divide the revenue across channels.
The first type is what we call heuristic methods. Heuristic means a practical method of achieving a goal, that is not necessarily optimal, but is good enough for now. Heuristic methods are used when figuring out the optimal way to do something is too costly, takes too much time or is simply impossible. So think of it as an approximation of the real solution.
The heuristic attribution models are all based on where in the customer journey you are. So they are essentially static. Here’s a few of the best-known ones.
First Touch Attribution
This model assigns 100% of the opportunity value to the first (oldest) interaction with the customer. As you can imagine, this model overestimates the impact of the first touchpoint. It is also quite useless if your customer journeys are all identical – what’s the point of a model if you always assign the value to the same interaction?
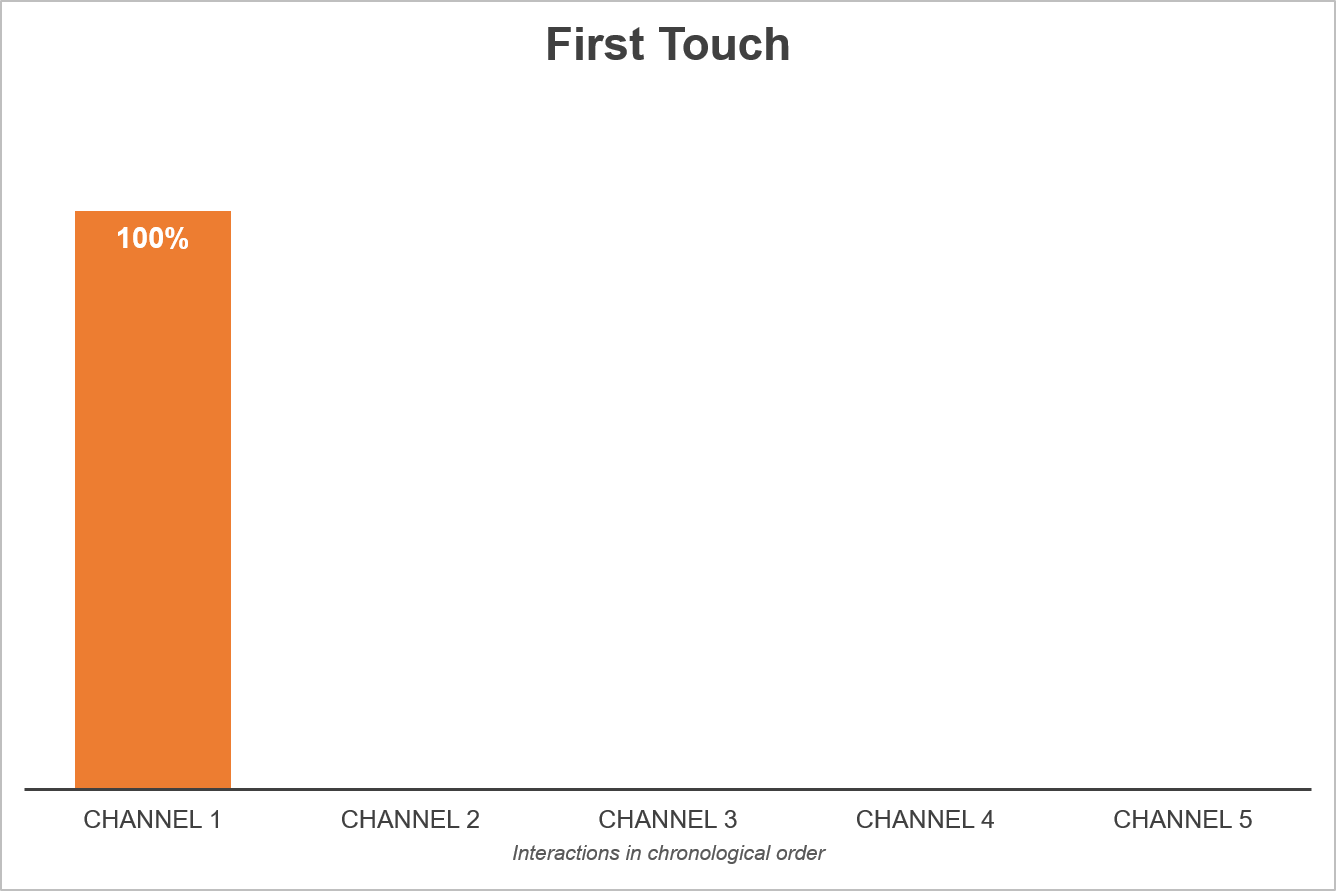
When to use it: First touch is helpful when you want to know which channels are most likely to bring new leads.
Last Touch Attribution
This model assigns 100% of the opportunity value to the most recent interaction with the customer. Basically, the last campaign that the prospect interacted with gets all the credit. This is also an imprecise model, as it ignores the impact of all the previous touchpoints your customer had with your company.
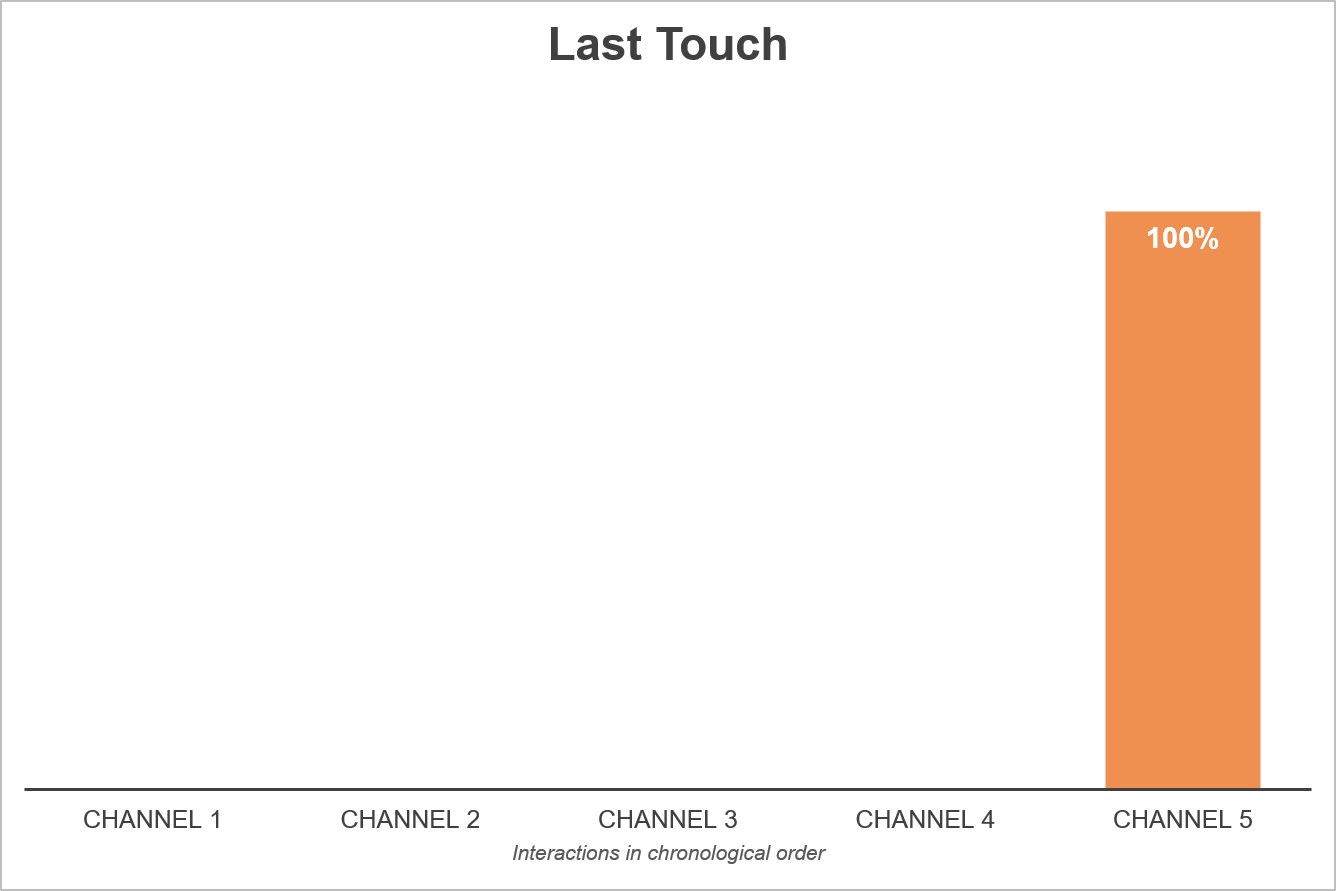
When to use it: Use last touch to figure out which campaigns / channels are your best deal closers.
Linear Attribution
This model distributes the opportunity value equally between all the interactions with the customer. It’s a more realistic (and democratic) way to split the revenue since all interactions get a fair share of the pie. It’s also probably your best bet if you don’t have a lot of information about your customer journeys. On the negative side, this model tends to overvalue the minor touchpoints of a journey.
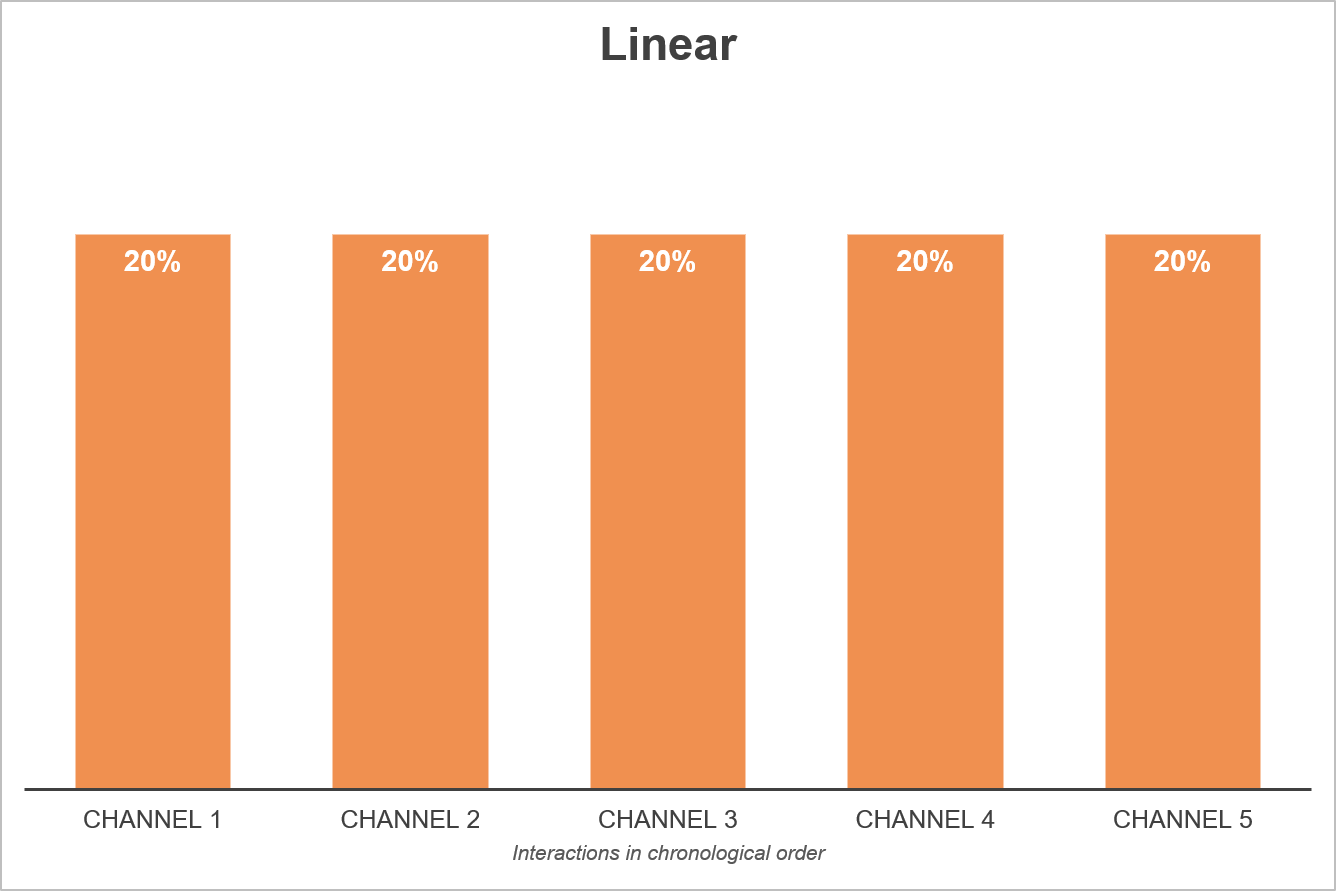
When to use it: It’s a good model to use for an overview of your channels, before you decide to remove any of them.
Position-Based (U-shaped or W-shaped) Attribution
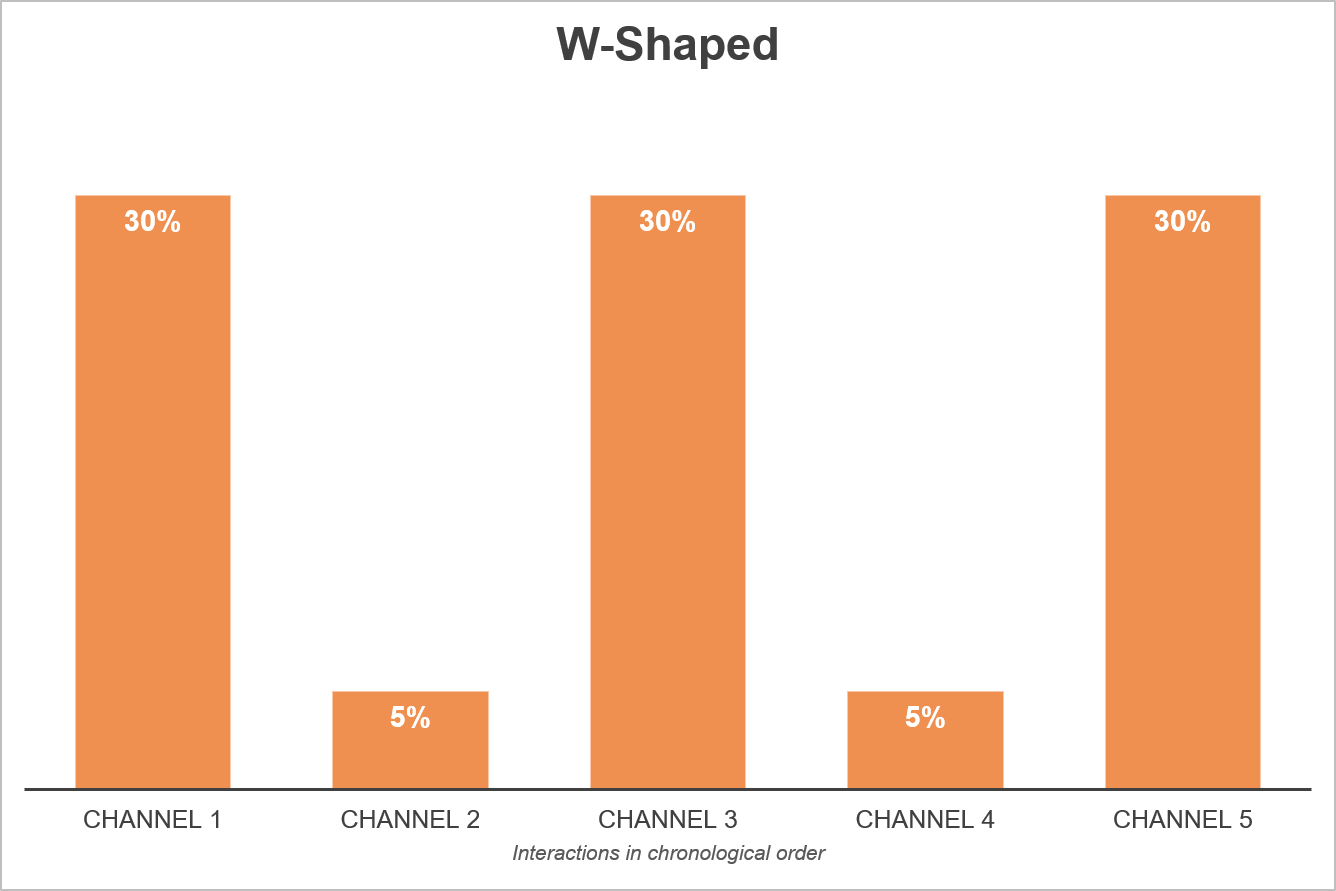
These models give a higher share of the revenue to the first interaction, the last, and sometimes (for the W-shaped) to a key interaction somewhere in the middle (either the lead conversion or the moment an opportunity is created).
The rest of the pie is then equally split between the rest.
It’s a somewhat more accurate model then the single touch ones, but it still overestimates the impact of some key touchpoints that you must decide on early in your process. That’s why it’s a dangerous model to use if you don’t have a clear overview of your customer journeys.
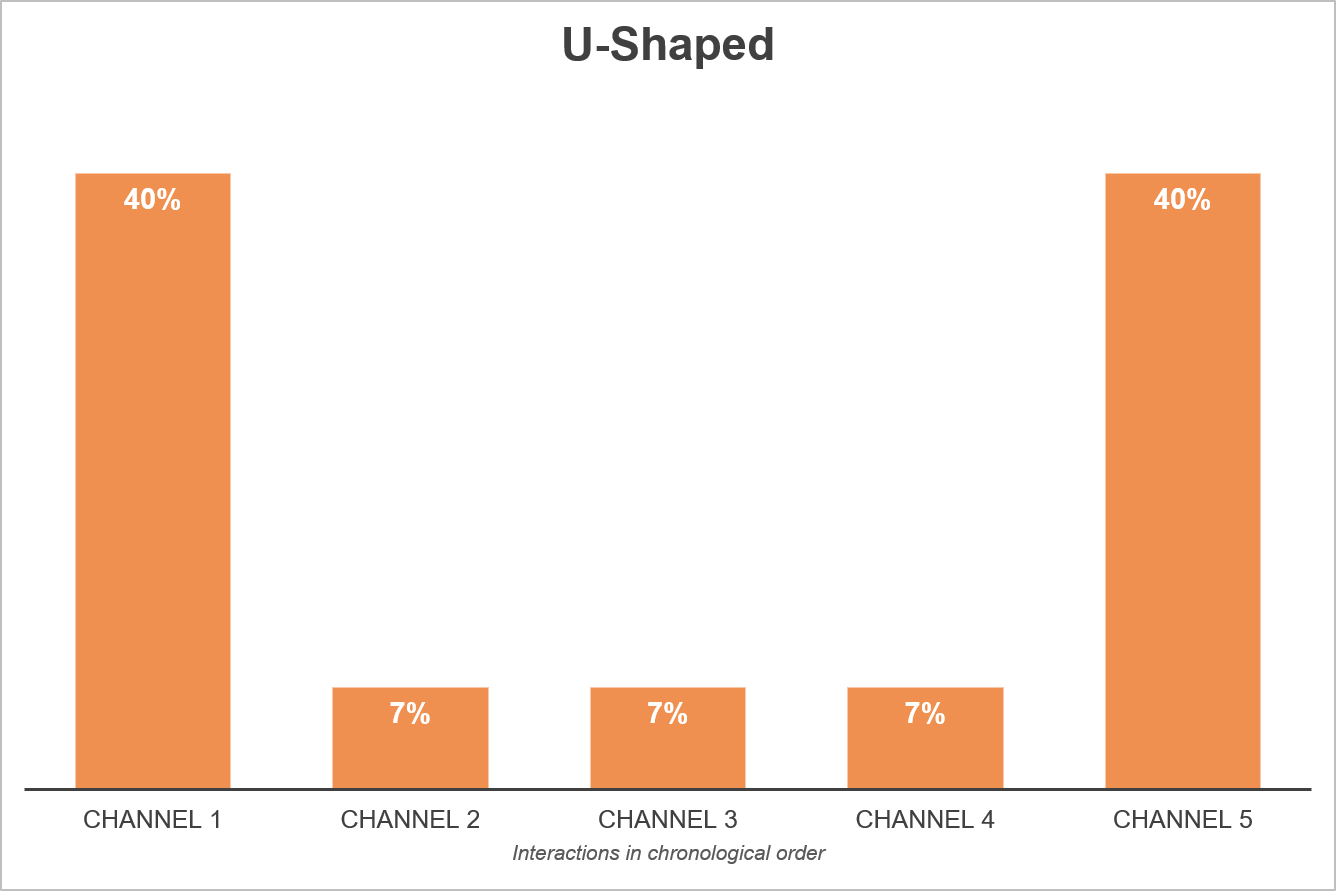
When to use it: when you want to pinpoint your lead generating channels as well as your closers, but you also want to acknowledge the other touches. Also, for the W-shaped model, it’s essential that your sales process is standardized, so everybody goes through the key touchpoint in the middle.
Time Decay Attribution
Here, the more recent a touchpoint is, the more money it gets. As time passes, the percentage assigned to a touchpoint decreases. It’s very intuitive to use this model, because, to quote Avinash Kaushik, if an early interaction was so great, why did it not convert? The downside, of course, is that the model overvalues the recent interactions.
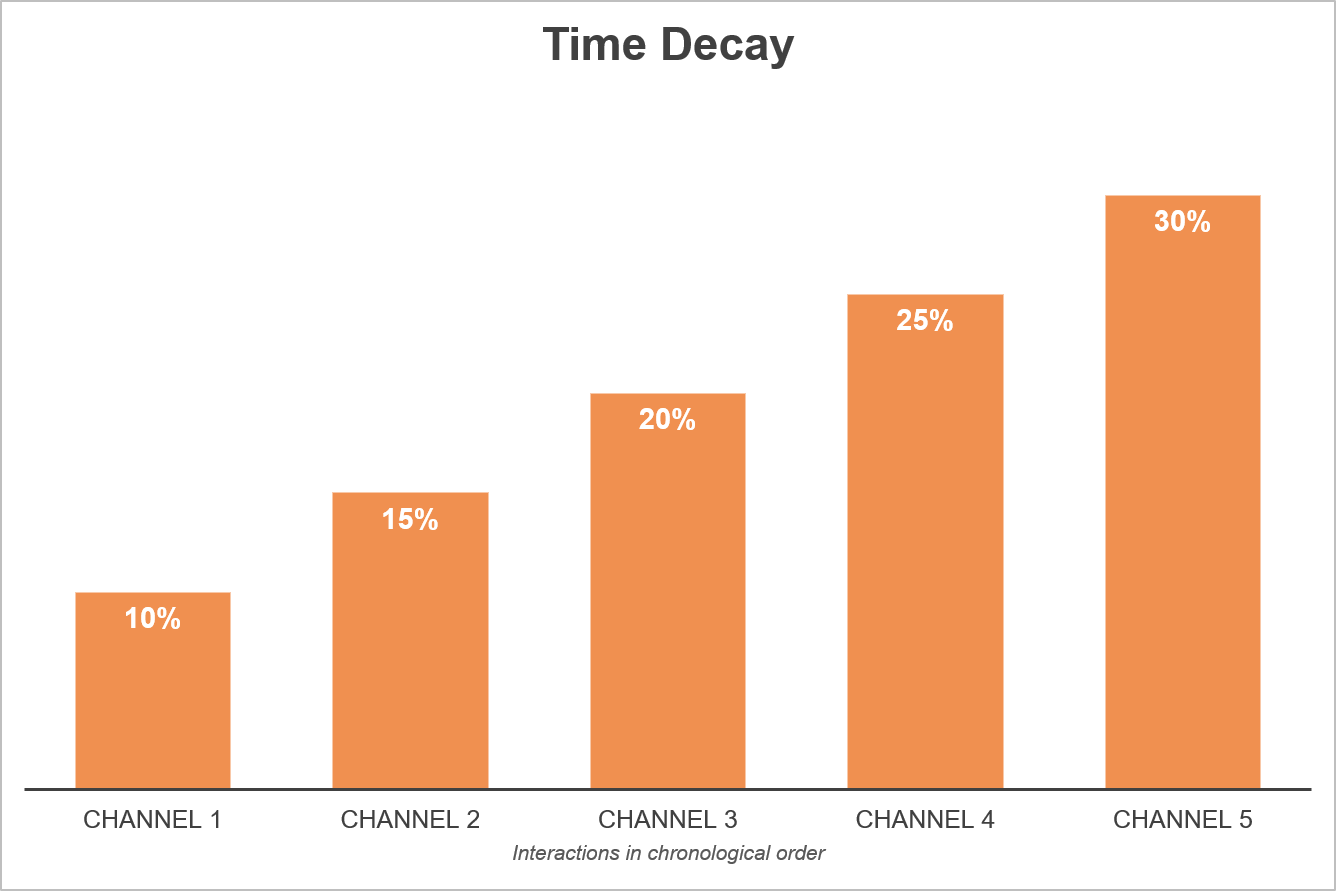
When to use it: if your sales cycle is long, you can use this model to pinpoint which channels are moving things along, as well as remove stale channels from the attribution process.
Custom Attribution
You can always manually assign weights to each type of channel, based on your gut feeling and experience. It’s a model only advanced users should consider, since it means you need to make an informed decision on how much each of your channels are worth.
It’s also a bit self-defeating: how can you tell the worth of each channel if you haven’t analyzed your historical data? The whole point of attribution is to find out how much each channel contributed, and here, instead, you make a decision before even doing that analysis…
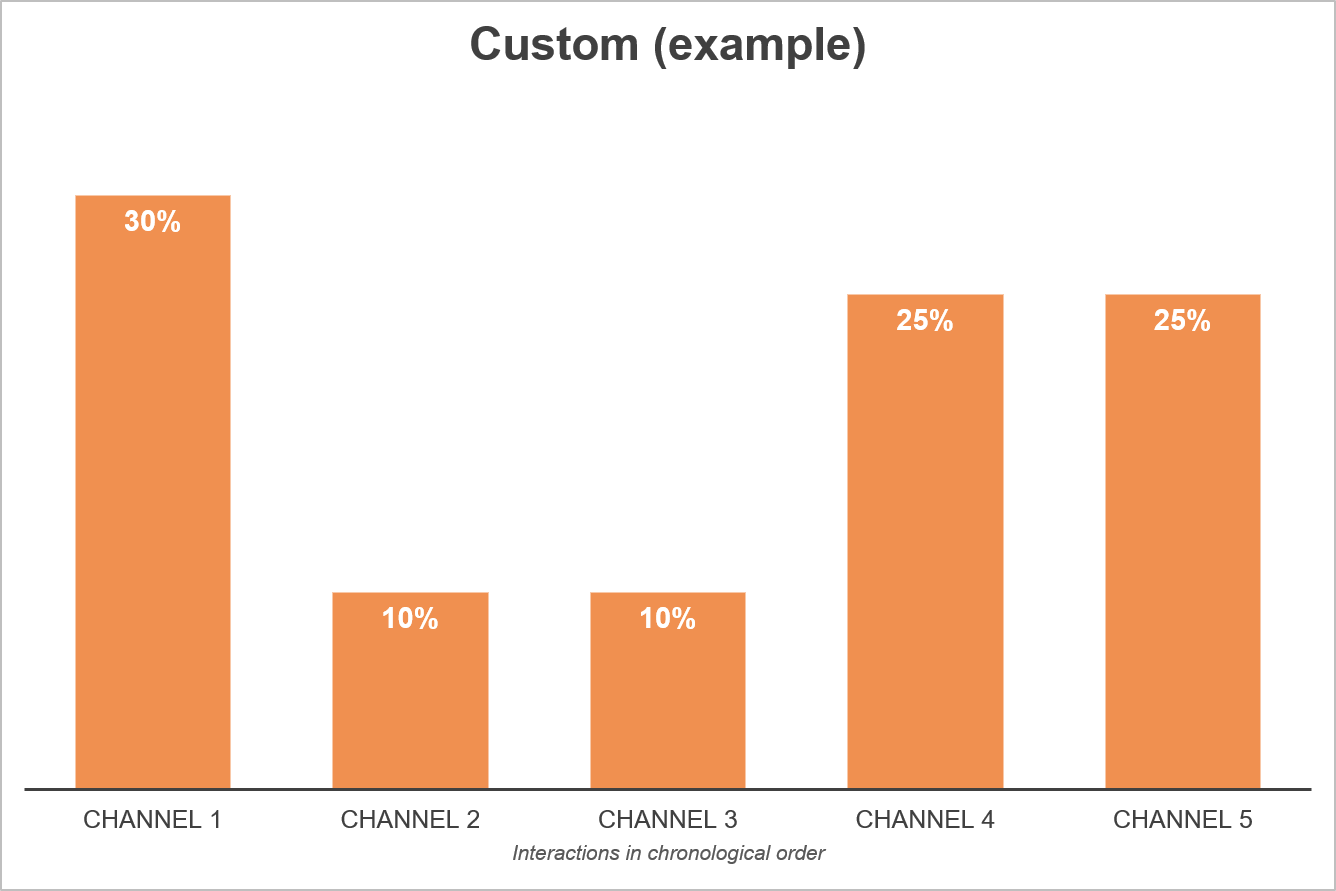
When to use it: When your sales people or marketing experts have accurate insight into what channels impact a lead the most.
Multi-Touch vs. Single-Touch attribution models – what is the better choice?
Another way to categorize these models is based on the number of interactions they consider. First touch and last touch are single-touch models, while the others are multi-touch models.
- Single-touch attribution models: First Touch and Last Touch
- Multi-touch attribution models: Linear, Position-Based, Time Decay, Custom and Probabilistic (Algorithmic)
It’s pretty intuitive to say that the multi-touch models are more accurate, since you’re not betting all your money on a single channel. It’s only fair to say all the interactions your lead had with your company contributed to some extent to the conversion, so to credit only the first one, the last one, or some other one in the middle may seem simplistic and reductionist.
Probabilistic (algorithmic) attribution model
And now… for the pièce de résistance… I mentioned that all the previous models are heuristic, as in they are not guaranteed to be optimal. They just do a decent job at approximating the contribution that each channel had – depending on what you want to achieve with your analysis.
If you want a really accurate map of your customer journeys, you need to use a second type of model, called probabilistic (or algorithmic) model. This type of model sifts through your historical data, and analyzes all customer journeys, be they successful or not.
Then, it computes the impact each of the touchpoints had by aggregating all the sales data. When the impact is calculated, you can use it to assign weights to each type of channel. No human (subjective) decision is necessary, you just let the historical data speak for itself.
So basically, you use machine learning to assign weights to your touchpoints, and then use those weights as a custom model. That makes more sense, right?
There are some established methods to compute these weights, but in Astapor Marketing Attribution, we use something called Markov chains analysis. It’s a relatively intuitive way of to calculate the impact each type of interaction had on your customer journeys.
How it works
First, we must decide on an attribute we will be analyzing for the touchpoints – e.g. campaign type. This will be the dimension we are weighing on.
Then, we build a graph of all customer journeys, that either ended with a conversion or not. The nodes of this graph will be the touchpoints of the journeys.
We then compute the total conversion probability for the entire historical data by adding up the individual probabilities of all successful paths.
The next step is to remove each type of touchpoint from the data set, and then re-calculate the conversion probability.
So let’s say your customer journeys consist, typically, of a Google ad campaign (A), a Facebook campaign (B), and a newsletter (C). The order of these three steps can vary.
Going through all your converted and not converted opportunities, we determined the conversion probability to be 30%.
Now, we’ll be removing interaction A from all the journeys, and then recalculate the probability to be 20%. This means that dropping A from the marketing mix made us lose a third of our conversions.
We do the same for B and C. We discover that, by removing B, the conversion probability is 10%, and by removing C, the conversion probability becomes 15%.
This means A’s impact will be 1 – 20/30 = 0.33 (33%).
The impact of B will be: 1 – 10/30 = 0.67, and for C, 1 – 15/30 = 0.5.
You will, of course, notice that 0.33 + 0.67 + 0.5 = 1.50 does not quite equal 1… Therefore, the last step is to normalize these impacts into 100-based weights.
A becomes 0.33/1.50 =~ 0.21, B will be 0.66/1.50 =~ 0.45, and C is 0.5/1.50 =~ 0.34. Now we’re up to a total of 1 (or 100%, if you prefer), and these are the weights that will be used to distribute the revenue across A, B and C.
This means all subjectivity has been removed from your decision, and the data itself gave you the answers you needed.
When not to use it: The downside of the probabilistic models is that you need to have historical data first. You can’t start using them until you have enough customer journeys to go through. How much is enough is something that varies from business to business, but there should be at least one successful and one unsuccessful customer path to analyze, otherwise you’ll end up with a linear distribution.
Before you get to that point, you should stick with one of the heuristic models.
Predict the conversion probability
Another cool thing about using a probabilistic model is that it also allows you to predict the conversion probability using some of the same steps. But more about prediction in our blog post Increase Your Conversion Rate in Salesforce With Astapor Marketing Attribution.
